sofyan salim

6 case studies

Work

Case studies from production systems: supply-chain maps, monitoring dashboards and data platforms for land and forests.
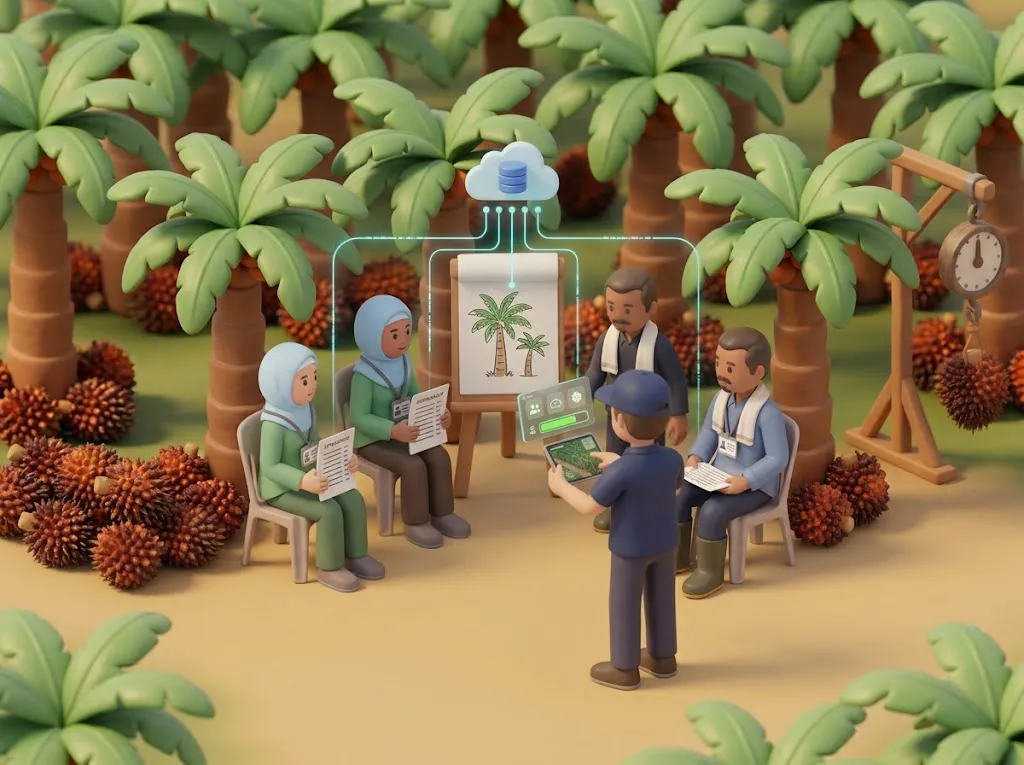
AI illustration of farmers with ID badges at a training session in an oil-palm plantation, a field officer entering data on a tablet, and glowing lines carrying the data up to a cloud database.0.60°N 101.45°E

WRI Indonesia · 2024 – Present

SmallholderHub MIS

One central system for a growing oil-palm smallholder programme in Riau. Farmers, land, training and harvests live in one place, so a report that once took weeks is now a click away.

Next.jsReactTypeScriptPostgreSQL
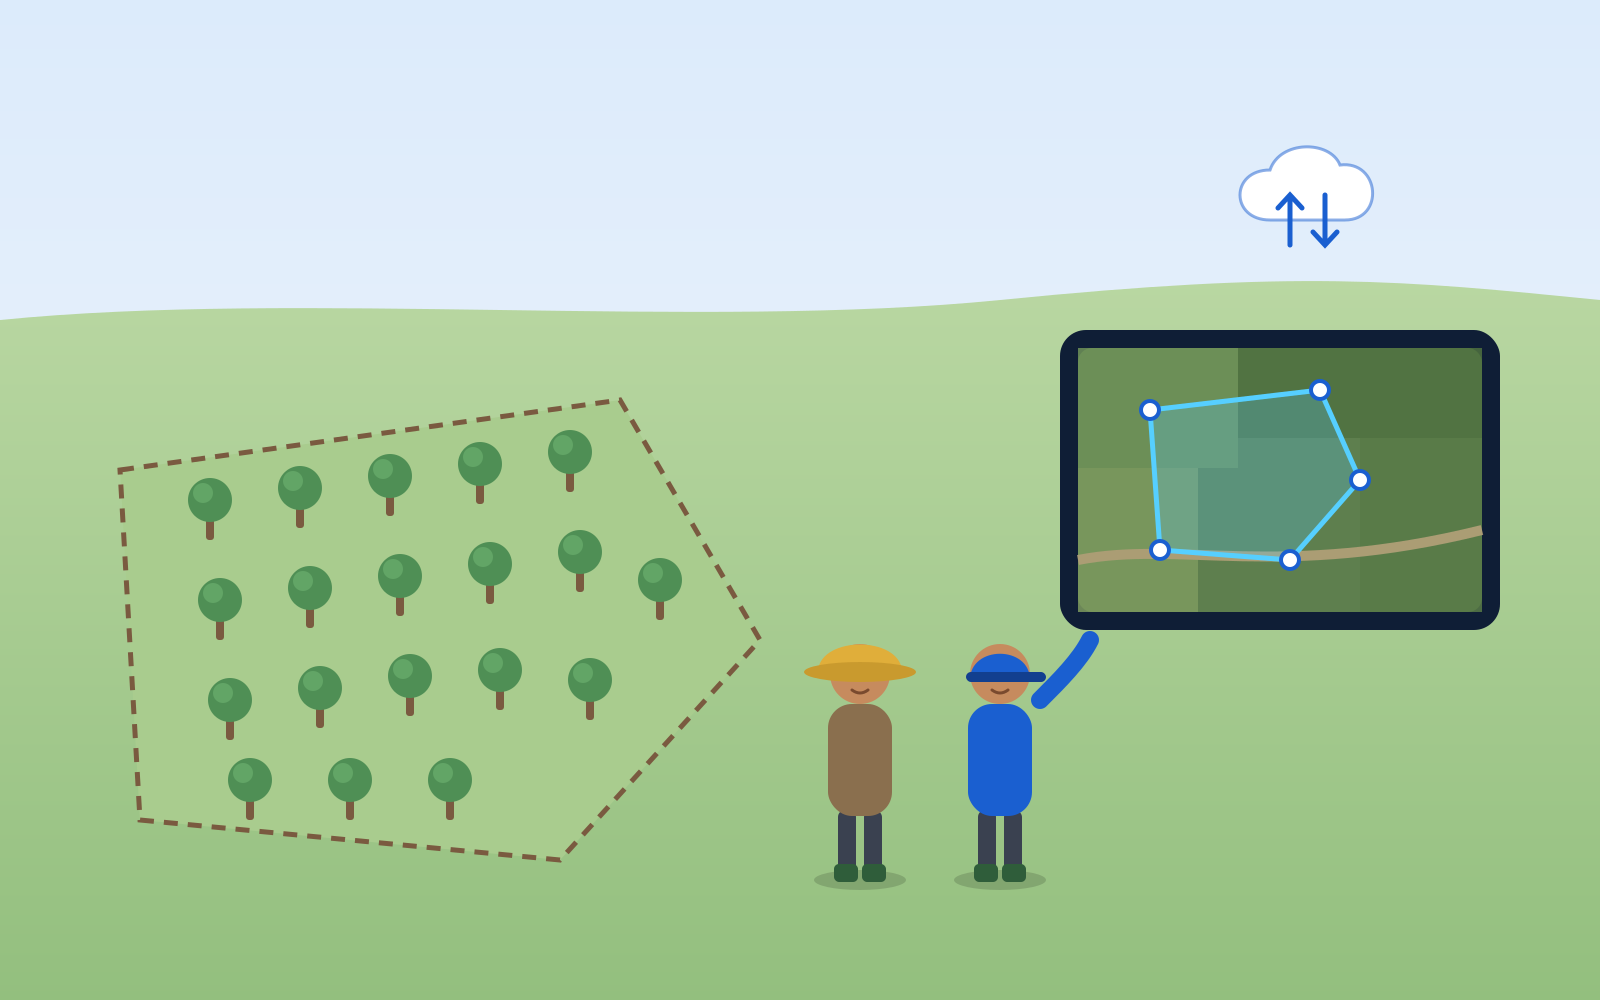
Illustration of a field officer and a farmer outlining a farm plot on a tablet over satellite imagery, with upload and download arrows.6.18°S 106.83°E

Koltiva · 2021 – 2024

Spatial Data Management

On-the-fly farm-polygon digitisation over satellite imagery, bulk upload/download pipelines, and GeoServer-backed basemaps and analysis services.

JavaScriptGeoServerPostgreSQLQGIS
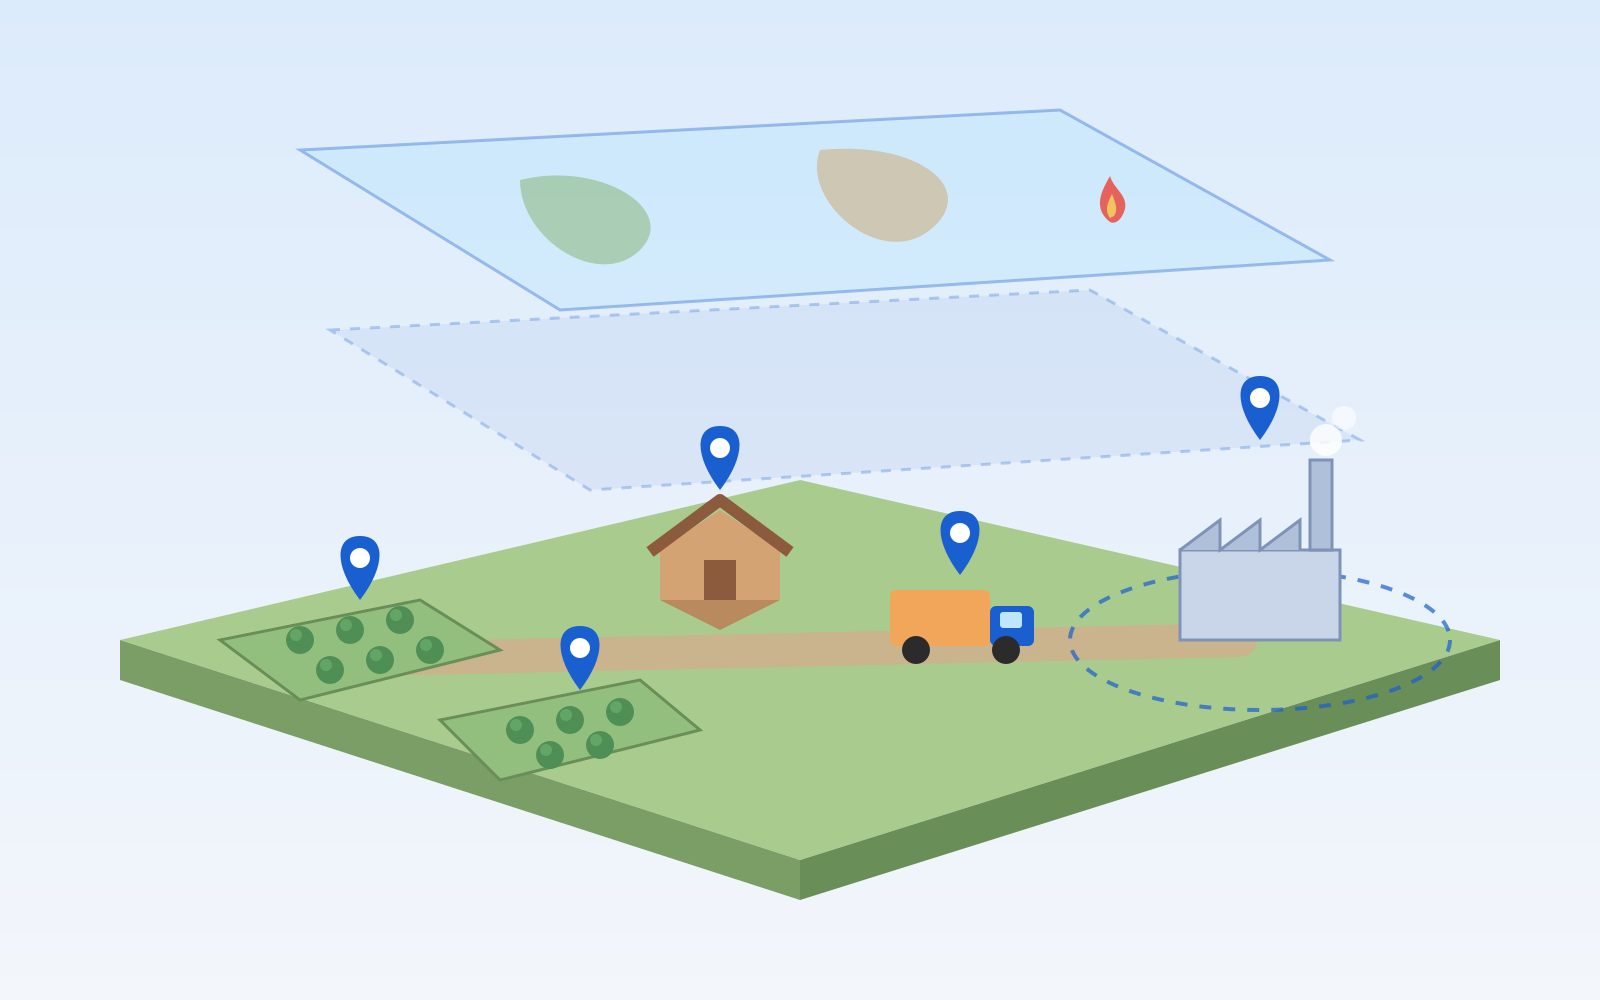
Illustration of a supply-chain landscape with farms, a collection point, a truck and a mill, each marked with a pin, and translucent map layers floating above.6.18°S 106.83°E

Koltiva · 2021 – 2024

Map of All Actors

An interactive map of every actor in a commodity supply chain, from farmers and their plots to collectors and mills, that I made reliable by putting GIS data standards in place.

PHP (CodeIgniter)ExtJSGoogle Maps APIGeoServer
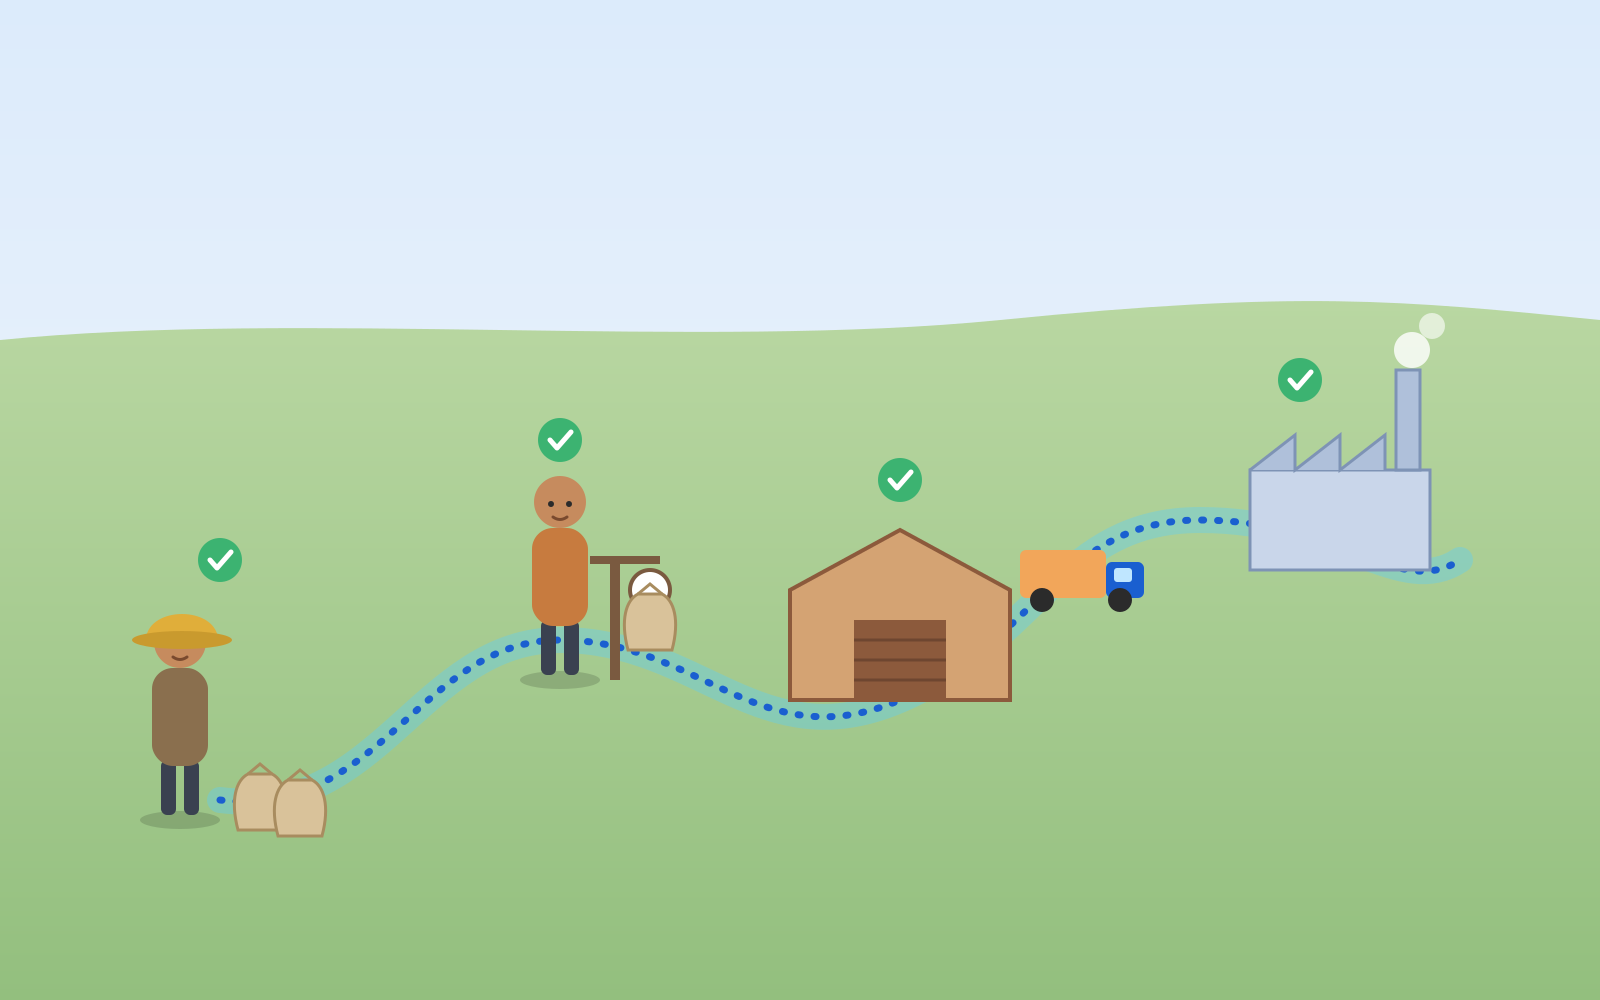
Illustration of a product's path from a farmer to a trader, a warehouse and a factory, joined by a glowing line with a check mark at each stop.6.18°S 106.83°E

Koltiva · 2021 – 2024

Traceability Map

End-to-end visualisation of product flow — from farmers to traders, warehouses and factories.

JavaScriptGoogle Maps APIGeoServerPostgreSQL
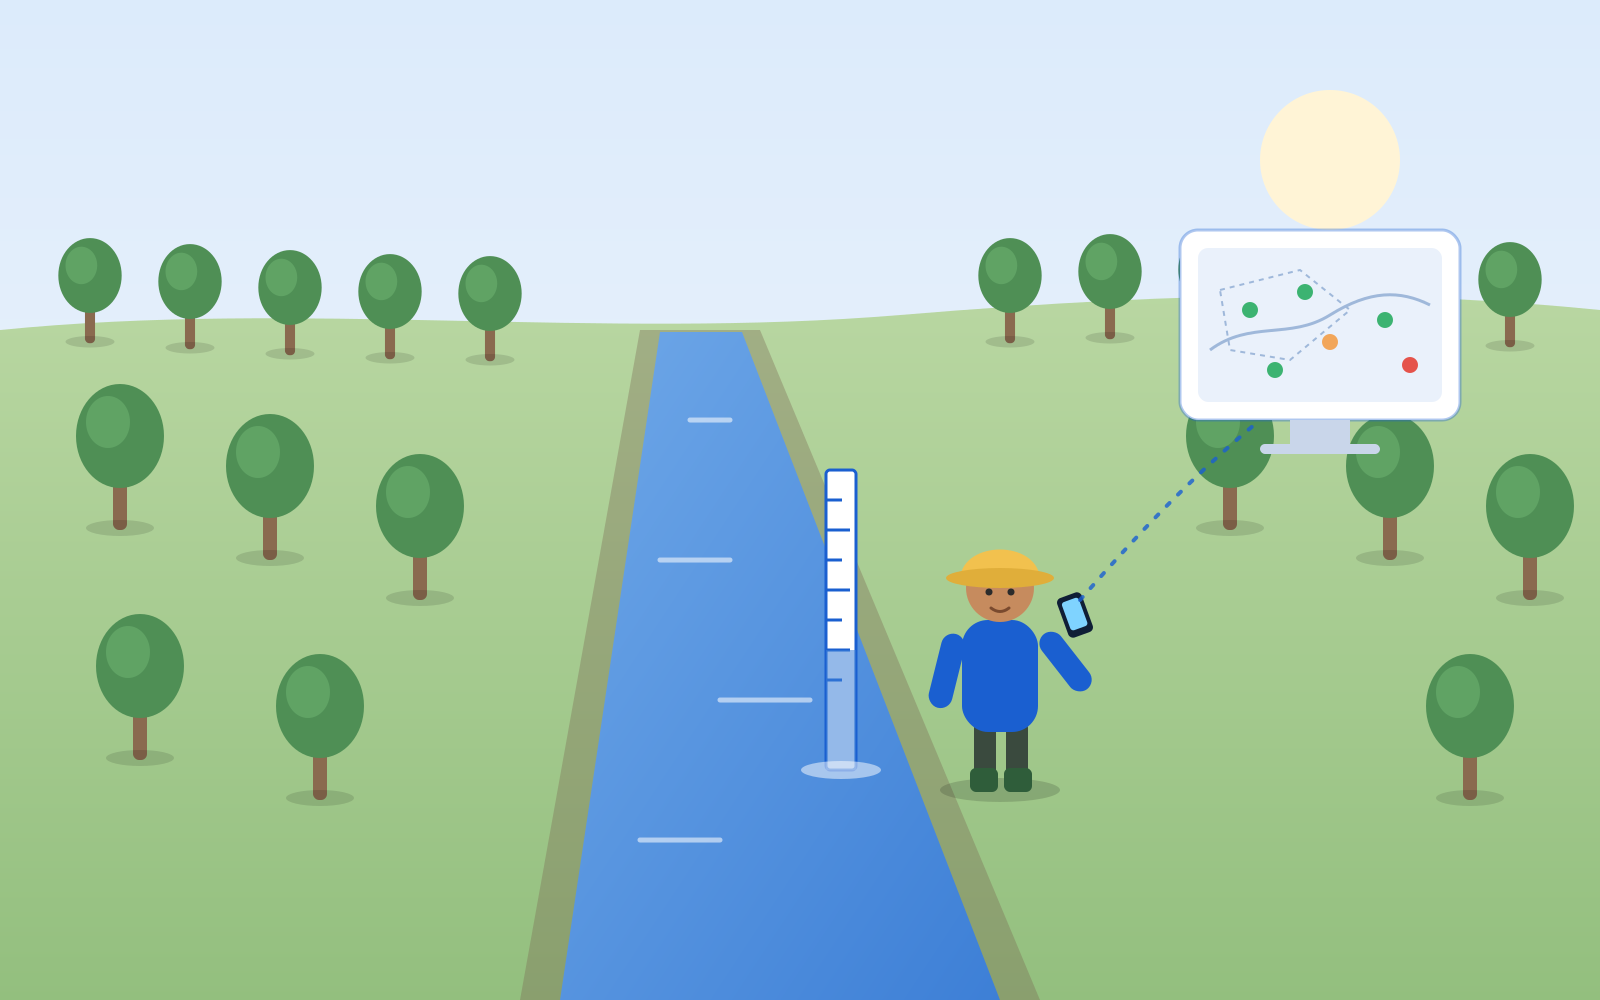
Illustration of a field worker reading a water-level gauge in a plantation canal and sending the reading from a phone to a dashboard map with status dots.6.20°S 106.82°E

Sinarmas Forestry · 2017 – 2019

OWMS — Operational Water Management System

A dashboard of real-time water-level status across plantation areas, fed by a field data-entry app and backed by enterprise GIS and hydrology models.

PHPJavaScriptSQL ServerArcGIS
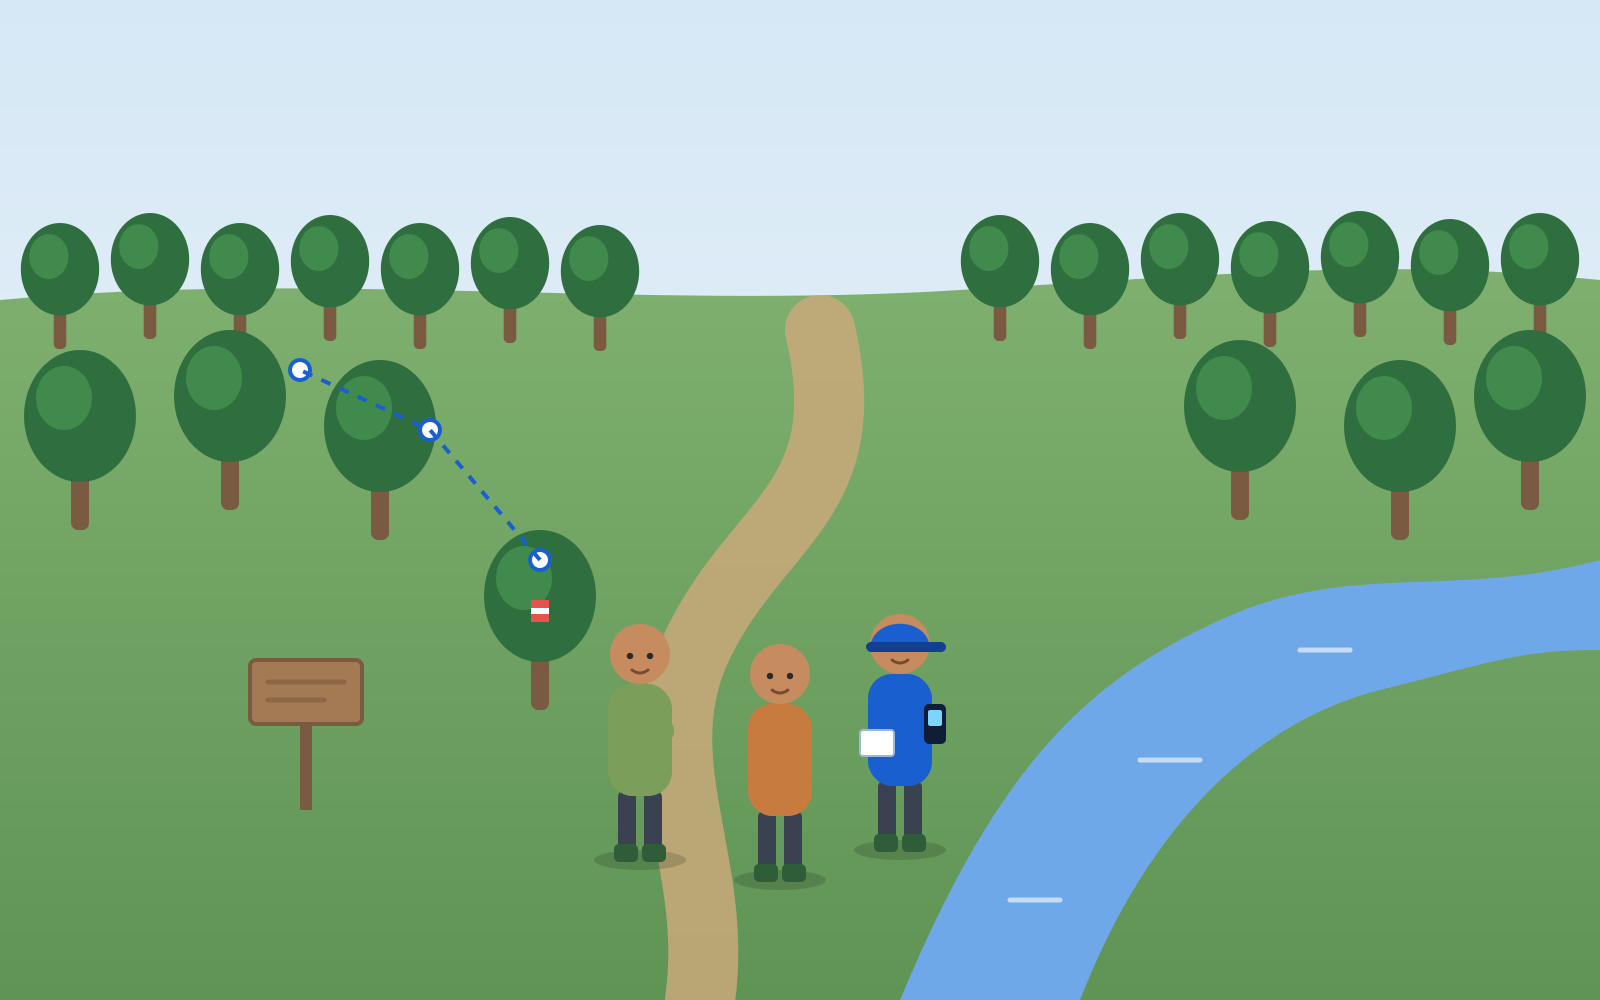
Illustration of a GIS field officer and two villagers mapping a community-forest boundary with a handheld GPS, next to a boundary tree marked with paint.1.61°S 103.61°E

KKI Warsi · 2012 – 2017

Spatial Data for Community Forests

Five years owning the full spatial-data lifecycle for an environmental NGO — field collection, analysis, modelling, reporting and web publishing.

ArcGISENVIeCognitionPHP

//Archive

Where it started: desktop GIS and data tools, 2008–2009.

2009BPKS SabangBPKSCustom ArcGIS · VBScript
2009Imagery StockBIGCustom ArcGIS · JavaScript
2008ETNIKBMKGVB 6.0 · ESRI MapObjects · MS Access
2008Land-cover change in Borneo (thesis)IPB UniversityRegional land-cover model

Contact

Have a map, a dataset or a platform in mind?

I am open to remote roles, freelance and consulting work, and conversations about geospatial tech.